
My complete stock analysis framework: how I evaluate every investment opportunity
The exact 7-step process I use to analyse stocks - from understanding the business to making the final investment decision

This post is for two types of people:
→ If you want to understand how I think about investments and why I make certain decisions, this framework will give you complete transparency into my process.
→ If you want to learn how to analyse stocks yourself and develop your own systematic approach to investing, this is perfect for you.
If neither of these interests you, feel free to skip this post.
The difference between successful investors and everyone else?
A systematic approach.
Warren Buffett follows the same checklist for every investment.
Ray Dalio built the world's largest hedge fund on systematic principles.
Peter Lynch never bought a stock without understanding the business first.
The best investors just don't rely on gut feelings or hot tips - they use strict and rational frameworks.
This isn't theory.
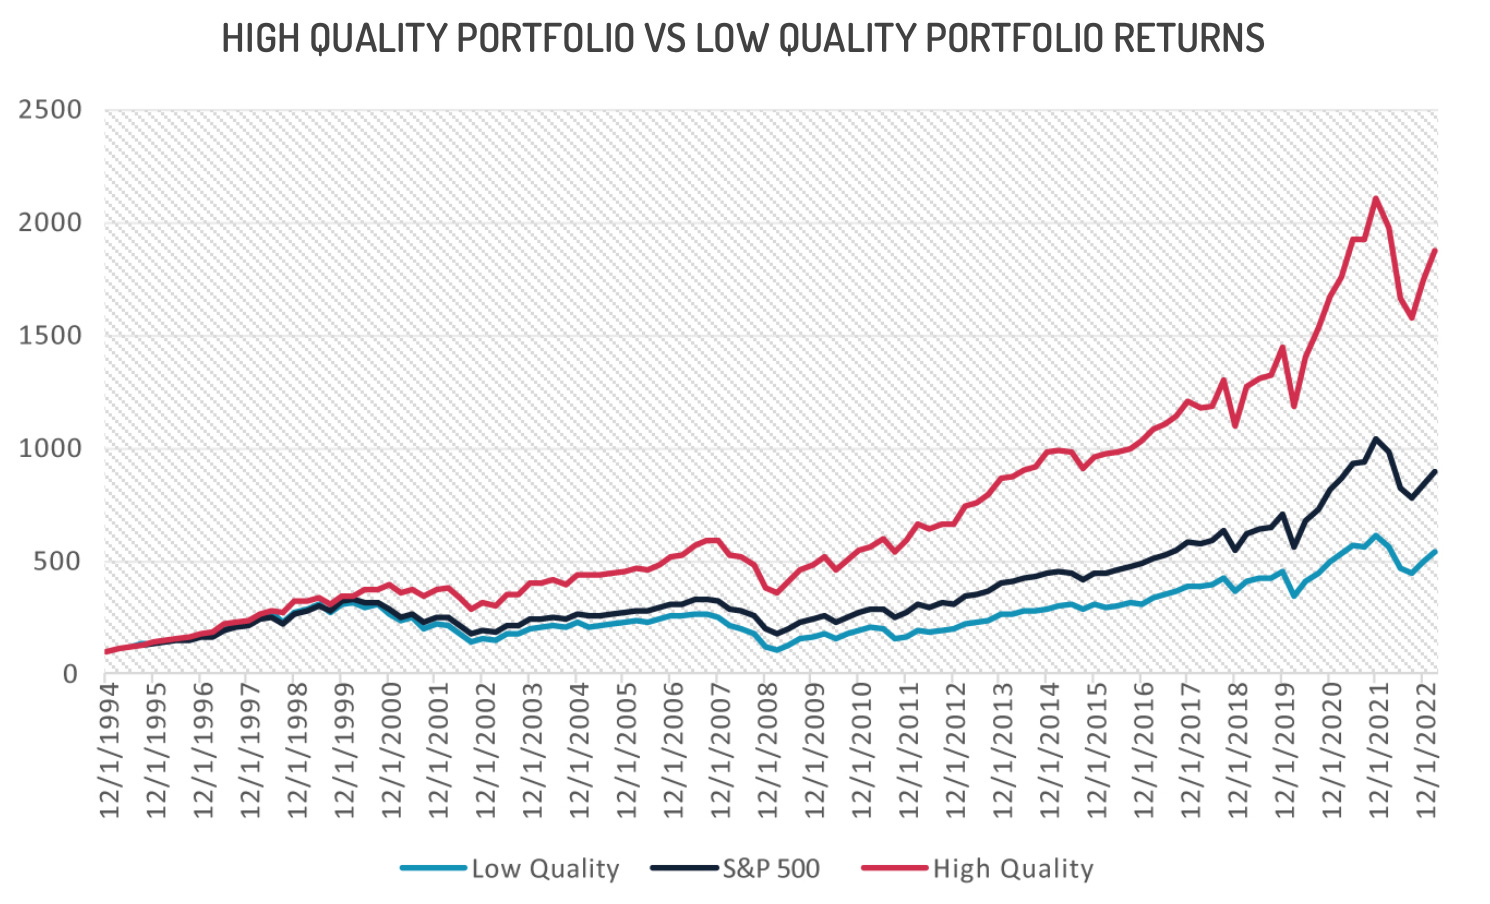
Companies that score high on systematic quality frameworks have outperformed the S&P 500 by 3-4% annually over the past 30 years.
And academic studies from firms like Morningstar consistently show that systematic approaches beat random stock picking by massive margins.
So today, I'll teach you how to analyse stocks using the same 7-step process that will give you confidence and trust in the companies you invest in.
Learn this once, use it forever.
1️⃣ Why you need a framework
Without a framework, investing becomes gambling.
I've seen too many investors buy stocks based on:
A friend's recommendation at the bar
A flashy headline in the financial news
FOMO after seeing a stock up 50% in a week
This approach leads to disaster.
Professional investors follow a disciplined process.
They ask the same questions, in the same order, for every single investment opportunity.
And the result?
Better decisions, fewer mistakes, and superior long-term returns.
2️⃣ A 7-step investment analysis framework
Step 1: Business model & industry attractiveness
The foundation of every great investment
Before you look at a single financial metric, you need to answer one fundamental question:
"Do I understand how this company makes money?"
If you can't explain the business model to a 12-year-old, don't invest.
Warren Buffett puts it perfectly:
"Know your circle of competence, and stick with it. The size of that circle is not very important; knowing its boundaries, however, is vital."
And what makes a business attractive?
The business model should be simple and elegant.
The best investments operate in industries with few competitors and high barriers to entry.
So you want growing markets, not declining ones.
A quick real example would be Deckers Outdoor Corporation ($DECK).

✅ Business Model: Premium footwear brands (UGG, HOKA)
✅ Revenue Source: High-margin shoes with brand loyalty
✅ Market Position: Premium positioning in footwear
✅ Assessment: Simple, understandable, attractive
Of course, not every business model is attractive.
Here are some of the warning signs that make me immediately move on:
Overly complex business models
Rapidly changing industries with no clear winners
Commoditised businesses with zero pricing power
Step 2: Management quality & competitive advantage
You're not buying a stock - you're partnering with people.
The first thing I really evaluate is the quality of the people running the company.
Because great management makes all the difference.
And there is one characteristic which more often than not separates the winners from the losers:
founder-led companies significantly outperform the market.
Why?
Well founders think like owners, not hired managers.
Of course this isn’t always possible for very large businesses, but it is a real big plus.
Other important things I look at are:
Strong track record of creating shareholder value? ✓
Founder or family still involved? ✓
Significant ownership stake? ✓
Happy employees? (I like to check Glassdoor for this) ✓
Next you should perform a moat analysis.
Every great investment needs a sustainable competitive advantage.
You’re basically trying to answer the question:
→ what differentiates this company from competitors?
Here are some of the most common moat types:
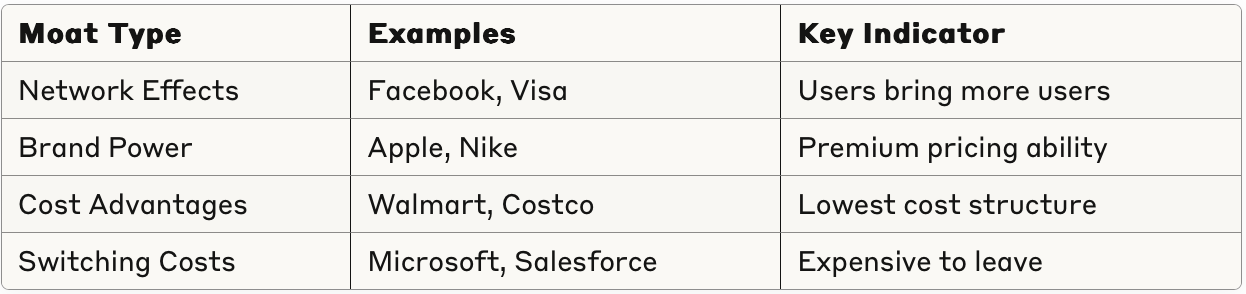
It also helps to remember this formula:
High and consistent gross margins + High Return on Invested Capital
=
Pricing power + Efficiency
That’s exactly what we’re looking for in a company.
Step 3: Financial health & capital allocation
Truth is this: a beautiful business can be destroyed by poor financial management
I usually start by performing a balance sheet health check.
Think of the balance sheet as the company's financial fitness report.
You want:
Debt levels → Reasonable for the industry
Goodwill → Lower is better (less acquisition risk)
Cash generation → Consistent and growing
"The best businesses require minimal ongoing capital investment."
Warren Buffett
Next we need to ask ourselves this:
How much capital does the company need to operate?
Great companies are capital-light and generate cash consistently.
Poor companies on the other hand tend to be more capital-hungry and burn cash constantly.
But here's what many investors miss: what management does with the cash they generate tells you everything about their priorities and competence.
So what should management do with the cash they generate?
There are really only four smart options.
Reinvest in the business (if high returns available)
Pay dividends (if mature, stable cash flows)
Buy back shares (if stock is undervalued)
Make acquisitions (if strategic and accretive)

What you want to see:
Management choosing the option that creates the most value
If they can reinvest at 20% returns, they should reinvest (not pay dividends)
If the stock trades at half its value, they should buy back shares (not make acquisitions)
If they're a mature company with limited growth, paying dividends makes sense
And pay attention to warning signs too:
→Making acquisitions when the stock is clearly undervalued
→Paying dividends when they could reinvest at high returns
→Empire building through expensive acquisitions
→No clear strategy or constantly changing approaches
There's also one metric I use all the time that tells you everything about how well management allocates capital.
Return on invested capital trend (ROIC).
This shows you the returns management generates on every dollar of capital they deploy.
Rising ROIC = excellent capital allocation.
Falling ROIC = poor decisions.
 | Formula + Calculator")
Step 4: Profitability & cash generation
Profits are opinions, but cash flow is fact
It’s really important for any investors to understand the difference between reported profits and actual cash generation.
Companies can manipulate earnings through accounting tricks, but cash flow tells the real story.
You can't fake cash in the bank.
The profitability framework works like this:
Revenue → Profit Margin → Net Income
↓
Free Cash Flow (the truth teller)
Now that you understand the flow from revenue to cash, let's look into the specific metrics that matter most.
Profit margins → How efficiently does the company convert sales to profit?
Cash conversion → Does the company translate earnings into actual cash?
Margin trends → Are they improving or deteriorating over time?
Beyond these basic metrics, there are deeper quality signals you should watch for: I call these the quality indicators.
🔍 Quality indicators:
Free Cash Flow should match Net Income
Working capital changes should be stable
Minimal non-cash charges and accounting tricks
There’s also something I call the dividend advantage.
The thing with dividends is they provide stability when stock prices don't.
During the 2000s, dividends were the only thing keeping portfolios above water during a lost decade.
And essentially, a company that can consistently pay and grow dividends demonstrates three critical qualities:
Predictable cash generation
They generate enough cash to pay shareholders regularlyManagement discipline
They're not wasting money on poor investmentsFinancial strength
They can maintain payments even during tough times
So this sort of tells you the business is genuinely profitable and well-managed, not just showing accounting profits.
Whenever I'm analysing a dividend-paying company, I run through this quick checklist:
✅ Sustainable payout ratio
✅ Consistent dividend growth
✅ Strong free cash flow coverage
Step 5: Growth track record & sustainability
Past performance provides crucial context
Here's the thing about growth - it's not just about the numbers.
And not all growth is created equal.
Here's how to separate real growth from fake growth:
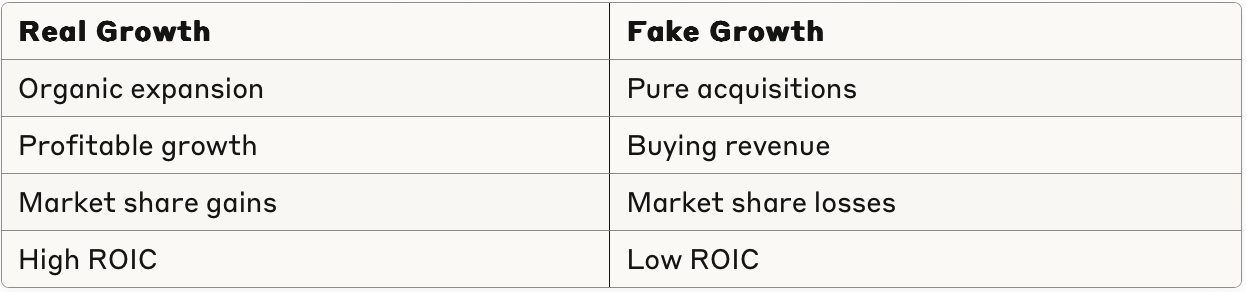
Once you understand what real growth looks like, you need to examine the company's track record.
Look at the past 5-10 years and ask:
Revenue growth consistency?
Earnings growth quality?
Return on invested capital trends (ROIC)?
Market share evolution?
Google is a great example of strong and consistent revenue growth:

But analyzing the past is only half the equation.
What really matters is whether this growth can continue.
Sustainable growth indicators are what you should also be looking at:
Growing market share in expanding markets
Strong product innovation pipeline
International expansion opportunities
Platform businesses with network effects
The best growth stories combine all four elements.
Step 6: Risk assessment & future outlook
Every investment has risks - are you being compensated?
Let me start with the most important concept in risk assessment.
The risk radar:
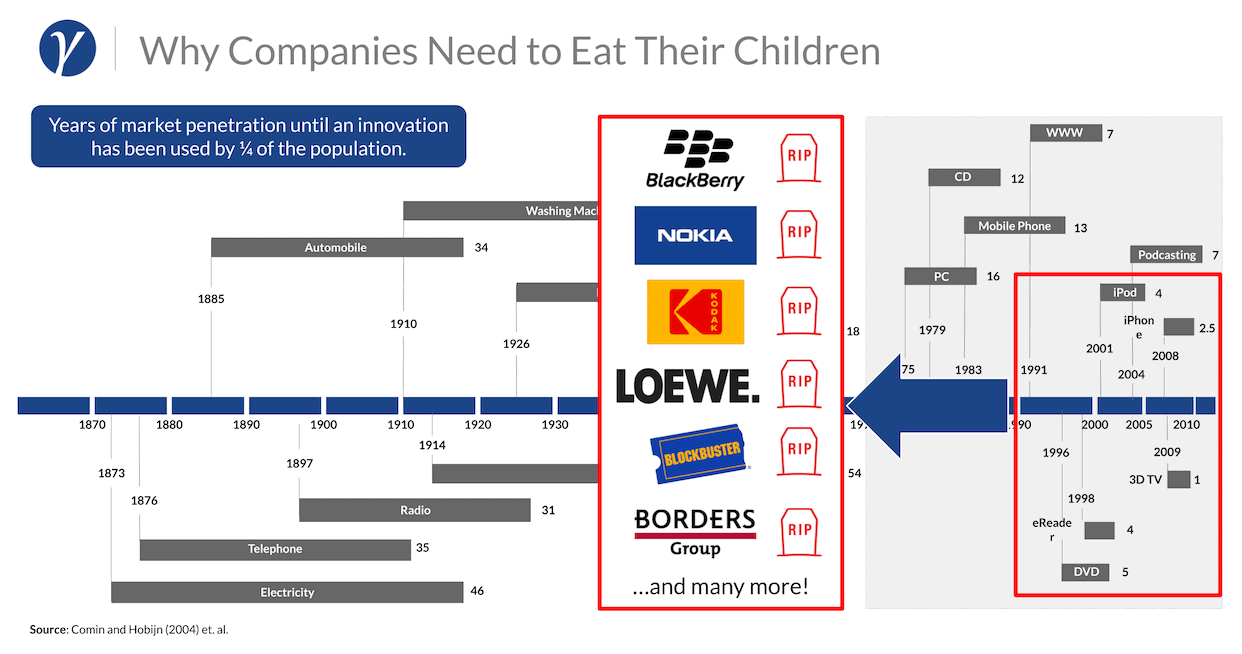
"Disruption is the worst enemy of every quality investor."
Companies like Nokia show how quickly dominant positions can disappear.
Your job is to identify what could go wrong before it happens.
Let me break down the major categories you should always consider.
🚨 Major risk categories:
Technology disruption → Could tech make this business obsolete?
New competition → Are new players entering the market?
Regulatory risk → Could government action hurt the business?
Economic sensitivity → How does this perform in recessions?
Here's a simple test I use to stress-test every investment.
The black swan test:
What's the worst-case scenario?
If this company faced its biggest nightmare, would it survive?
The best investments can ideally weather multiple storms.
Future outlook questions:
Management's strategic vision realistic?
Industry tailwinds or headwinds ahead?
Competitive position strengthening or weakening?
Step 7: Valuation & Investment Decision
Price is what you pay, value is what you get
Most investors get lost in complex Excel models and 50-page DCF spreadsheets.
The investing beasts keep it simple.
Warren Buffett famously does his valuations on the back of an envelope.
I use a three-pillar approach that gives me complete confidence in my valuation decisions.
These three methods complement each other well and are used by some of the best investors.
Pillar 1: Reverse DCF analysis
What growth is the market expecting?
Instead of trying to predict the future, I work backwards from today's stock price. This is the most powerful question in investing: "What is the market expecting?"
Current stock price → Required Return Rate → Implied Growth Rate
Here's how it works: Take the current stock price, use your required return rate (typically 10-12%), and calculate what annual growth rate is already baked into the price.
And then I ask myself this key question:
Is this implied growth rate realistic given the company's competitive position and market opportunity?
If the market expects 15% annual growth but the company operates in a mature market growing at 3%, that's a red flag.
If the market expects only 5% growth from a dominant company in an expanding market, that might be opportunity.
Pillar 2: Free cash flow yield
The ultimate measure of cash generation
Free cash flow yield offers investors a better measure of a company's fundamental performance than the widely used P/E ratio.
Here's why this metric is so powerful:
Free Cash Flow Yield = Free Cash Flow ÷ Enterprise Value
Money in the bank is what every company strives to achieve.
It is more difficult to hide financial misdeeds and management adjustments in the cash flow statement.
Warren Buffett for example focuses obsessively on cash generation.

He believes the free cash flow amount is one of the most accurate ways to check a company's financial condition.
What to look for:
High FCF Yield (8%+): Company generating substantial cash relative to its value
Stable FCF Yield: Consistent cash generation over multiple years
Growing FCF Yield: Improving cash generation efficiency
The beauty of FCF yield is that a higher free cash flow yield represents a more attractive investment and can determine an investor's payback period.
Pillar 3: EV/EBIT Analysis
Operating efficiency without accounting tricks
This is my preferred multiple because it cuts through the noise and focuses on pure operating performance.
Enterprise Value = Market Cap + Total Debt - Cash
EV/EBIT = Enterprise Value ÷ Operating Income
Why EV/EBIT beats P/E ratios:
✓ Capital structure neutral - Compare companies regardless of debt levels
✓ Operating focus - Excludes financial engineering and one-time items
✓ More accurate - Represents what an acquirer would actually pay
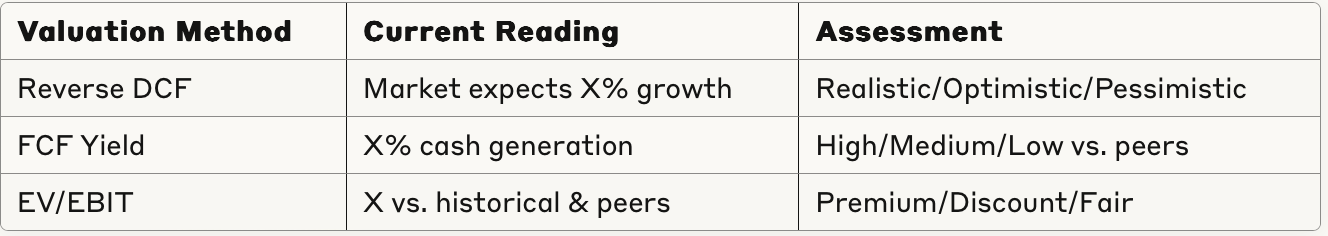
And then compare it across three dimensions:
Current EV/EBIT vs. company's 5-year historical average
Current EV/EBIT vs. industry peer group median
Current EV/EBIT vs. broader market average
I have found this combination of pillars to work perfectly together;
Pillar 1 (Reverse DCF) tells you what the market believes about future growth
Pillar 2 (FCF Yield) tells you how much cash the business actually generates today
Pillar 3 (EV/EBIT) tells you how efficiently the company converts revenue to operating profit
Together, they give you a complete picture: market expectations + cash reality + operational efficiency.
After completing all three valuation pillars, you can create your decision matrix.
The Investment Decision:
When all three pillars align positively (realistic growth expectations + high FCF yield + attractive EV/EBIT), you have a highly attractive valuation.
When two out of three are positive, it's worth deeper analysis or watch list consideration.
Finally, consider how this investment fits into your broader strategy.
When only one pillar is positive, it's usually better to pass and wait for a better opportunity.
3️⃣ The complete scoring system
When I’m done with my analysis, I proceed to rating each step 1-10:
🏢 Step 1: Business Model         ___ /10 (High Weight)
👥 Step 2: Management & Moat      ___ /10 (High Weight)
💰 Step 3: Financial Health       ___ /10 (Medium Weight)
📈 Step 4: Profitability         ___ /10 (High Weight)
🚀 Step 5: Growth Track Record    ___ /10 (Medium Weight)
⚠️ Step 6: Risk Assessment        ___ /10 (High Weight)
💵 Step 7: Valuation             ___ /10 (Medium Weight)

Total Quality Score: ___ /10
Based on this total score, here's how to then make your investment decision:
🟢 8-10: STRONG BUY → High-quality company at attractive valuation
🟡 6-7.9: WATCH LIST → Good company, wait for better price
🟠 4-5.9: CONDITIONAL → Deeper analysis required, unlikely pick
🔴 <4: PASS → Too many red flags
4️⃣ A quick real-world application

Example: My quick analysis of Deckers Outdoor ($DECK)
The Setup: Stock down 50% YTD, Forward P/E of 16.5x
My Analysis:
Step 1 - Business Model: 9/10
Premium footwear with UGG and HOKA brands - simple and attractive
Step 2 - Management/Moat: 7/10
Strong brand loyalty, but management track record mixed
Step 3 - Financial Health: 9/10
Solid balance sheet, reasonable debt levels
Step 4 - Profitability: 8/10
High margins, excellent cash generation
Step 5 - Growth: 7/10
HOKA growing rapidly, UGG more mature
Step 6 - Risks: 6/10
Fashion trends can be fickle, competition increasing
Step 7 - Valuation: 9/10
Significantly beaten down, attractive entry point
Total Score: 7.9/10 → GOOD COMPANY, POSSIBLE BUY, add to Watchlist
5️⃣ Final tips so you can master this
When it comes to this checklist, I follow certain golden rules.
I’d recommend you to do the same.
I always use this exact order → Each step builds on the previous one
I am brutally honest → If a company fails badly on any step, usually better to pass
Quality first, price second → Great business at fair price > Fair business at great price
When in doubt, I wait → Great opportunities should be obvious
I track my accuracy → Learn from both wins and losses
Personally I also keep a spreadsheet of every analysis.
And I go a step further by tracking my scores vs. actual performance over 1-3 years.
This creates a feedback loop for me which helps me improve my skill over time.
Now it’s your turn
Start with one stock and work through all 7 steps. Don't worry about being perfect - consistency is what matters.
Track your results over time. This feedback loop will make you a better investor faster than any course ever could.
Master this framework, and you'll never invest blindly again.
Questions? Drop them in the comments.
Whether you're stuck on a specific step or want to discuss a company analysis - I'm here to help.